National Air and Space Administration
Perception analytics assesses the effectiveness of NASA sonifications. Without evidence for the value of these data vivificatons, funding may become scarce. We design, implement, and analyze surveys to explore the benefits of this form of interaction with data that ensure that ongoing funding is available to continue this important work of making astronomical data beautiful for everyone.
UC Irvine
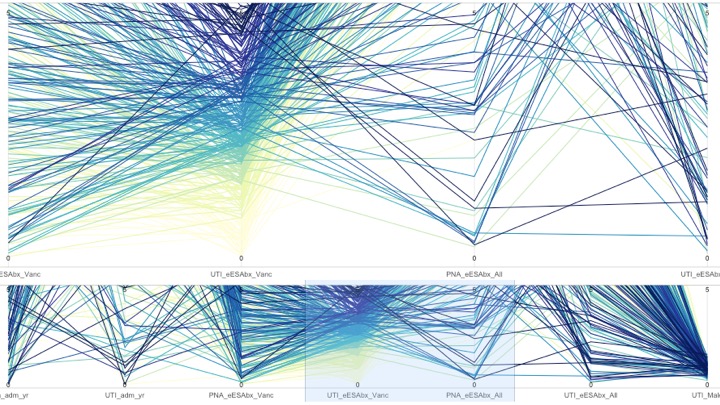
The Centers for Disease Control and Prevention were very impressed with the shiny web application built by Perception Analytics. It allows investigators to practice randomizing sets of matched pairs to ensure a more balanced trial. Users upload data, choose the number of variables and the importance of each variable with which to find matched pairs. From here, the application randomizes repeatedly and researchers explore the parallel coordinate plot to ensure a balanced trial at randomization. More information can be found in our publication here.
United Nations retiree’s agencies
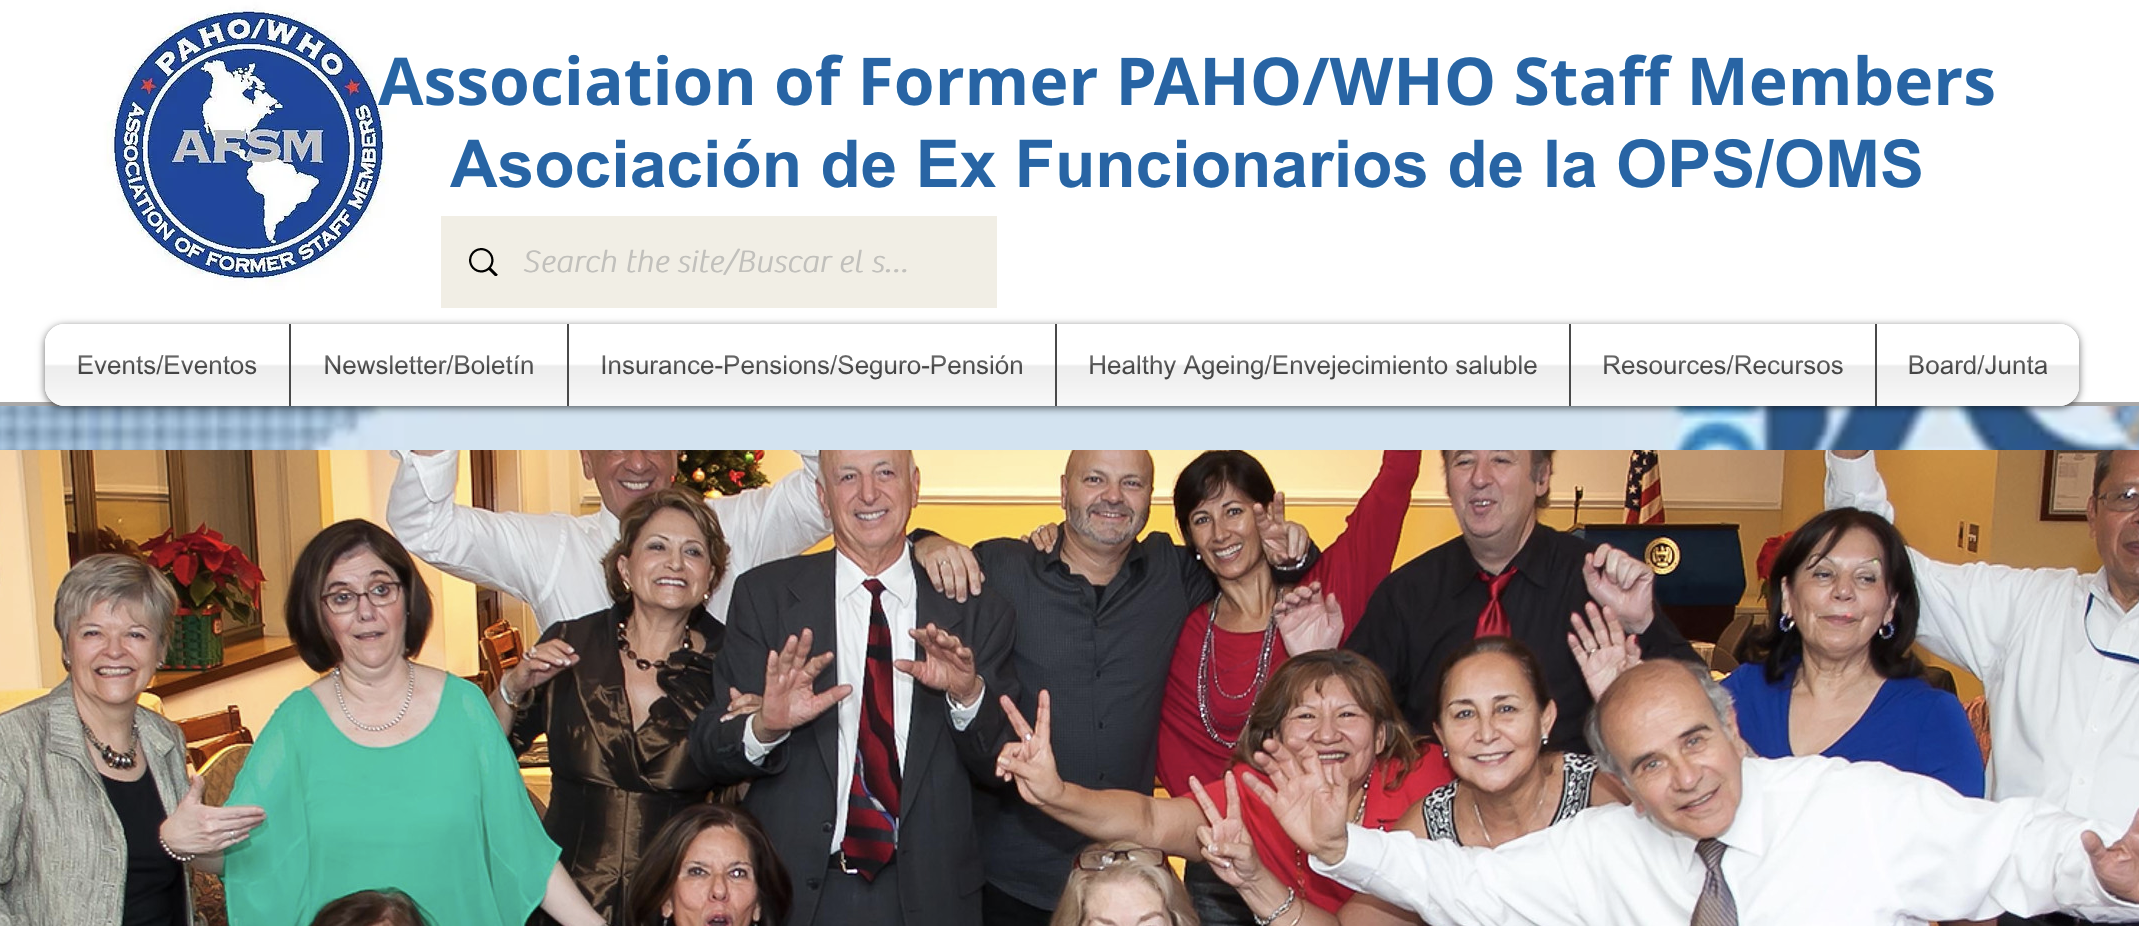
The Pan American Health Organization/World Health Organization Association of Former Staff Members had an outdated website that was difficult for their elderly members to access. Perception Analytics assessed the existing website and recognized two issues: the lack of language support for Spanish-speaking retirees, and the complex navigation. We recommended ways to simplify the structure of the site and to incorporate the bilingual population. The improved website has been well received among the membership.
Cloud Migration
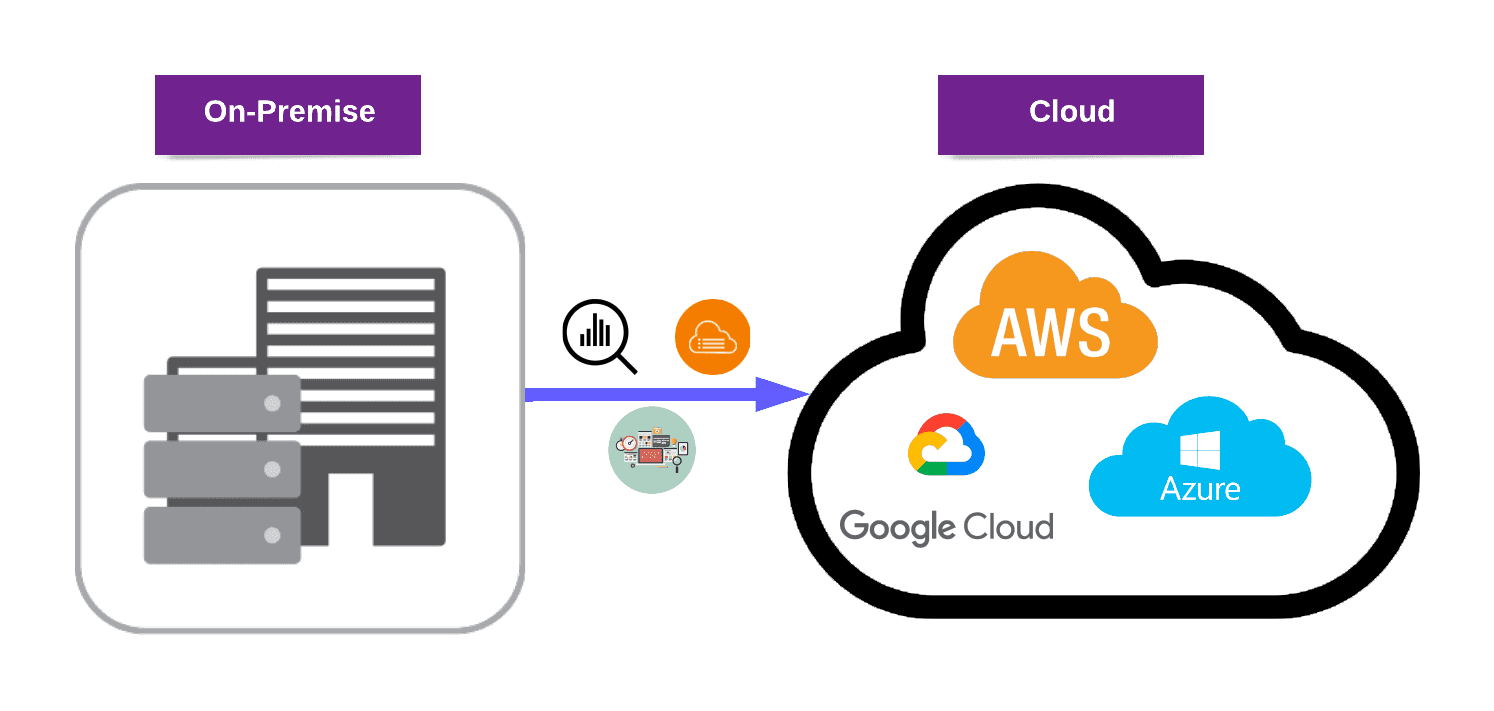
Perception analytics helped large financial institution migrate a large number of On-Premise SharePoint sites from 2013 to SharePoint Online. First, we analyzed the existing inventory of On-Premise sites for data classification and site customization, then we developed metrics to determine complexity and value of each site and prioritized each site migration in waves based on complexity/value metrics. Using an Iterative method over 2-weeks, we migrated all the sites using Sharegate for structure and content migration. We also rewrote the workflows and forms in power automate and power apps.
Technology Re-Platform

Migrated custom applications developed using older(obsolete) technologies to a new platform. Migrated application written in InfoPath forms and SharePoint designer workflows to Power automate flows and Power Apps forms. Over 2000 forms and workflows were rewritten as part of re-platforming initiative
Process Automation
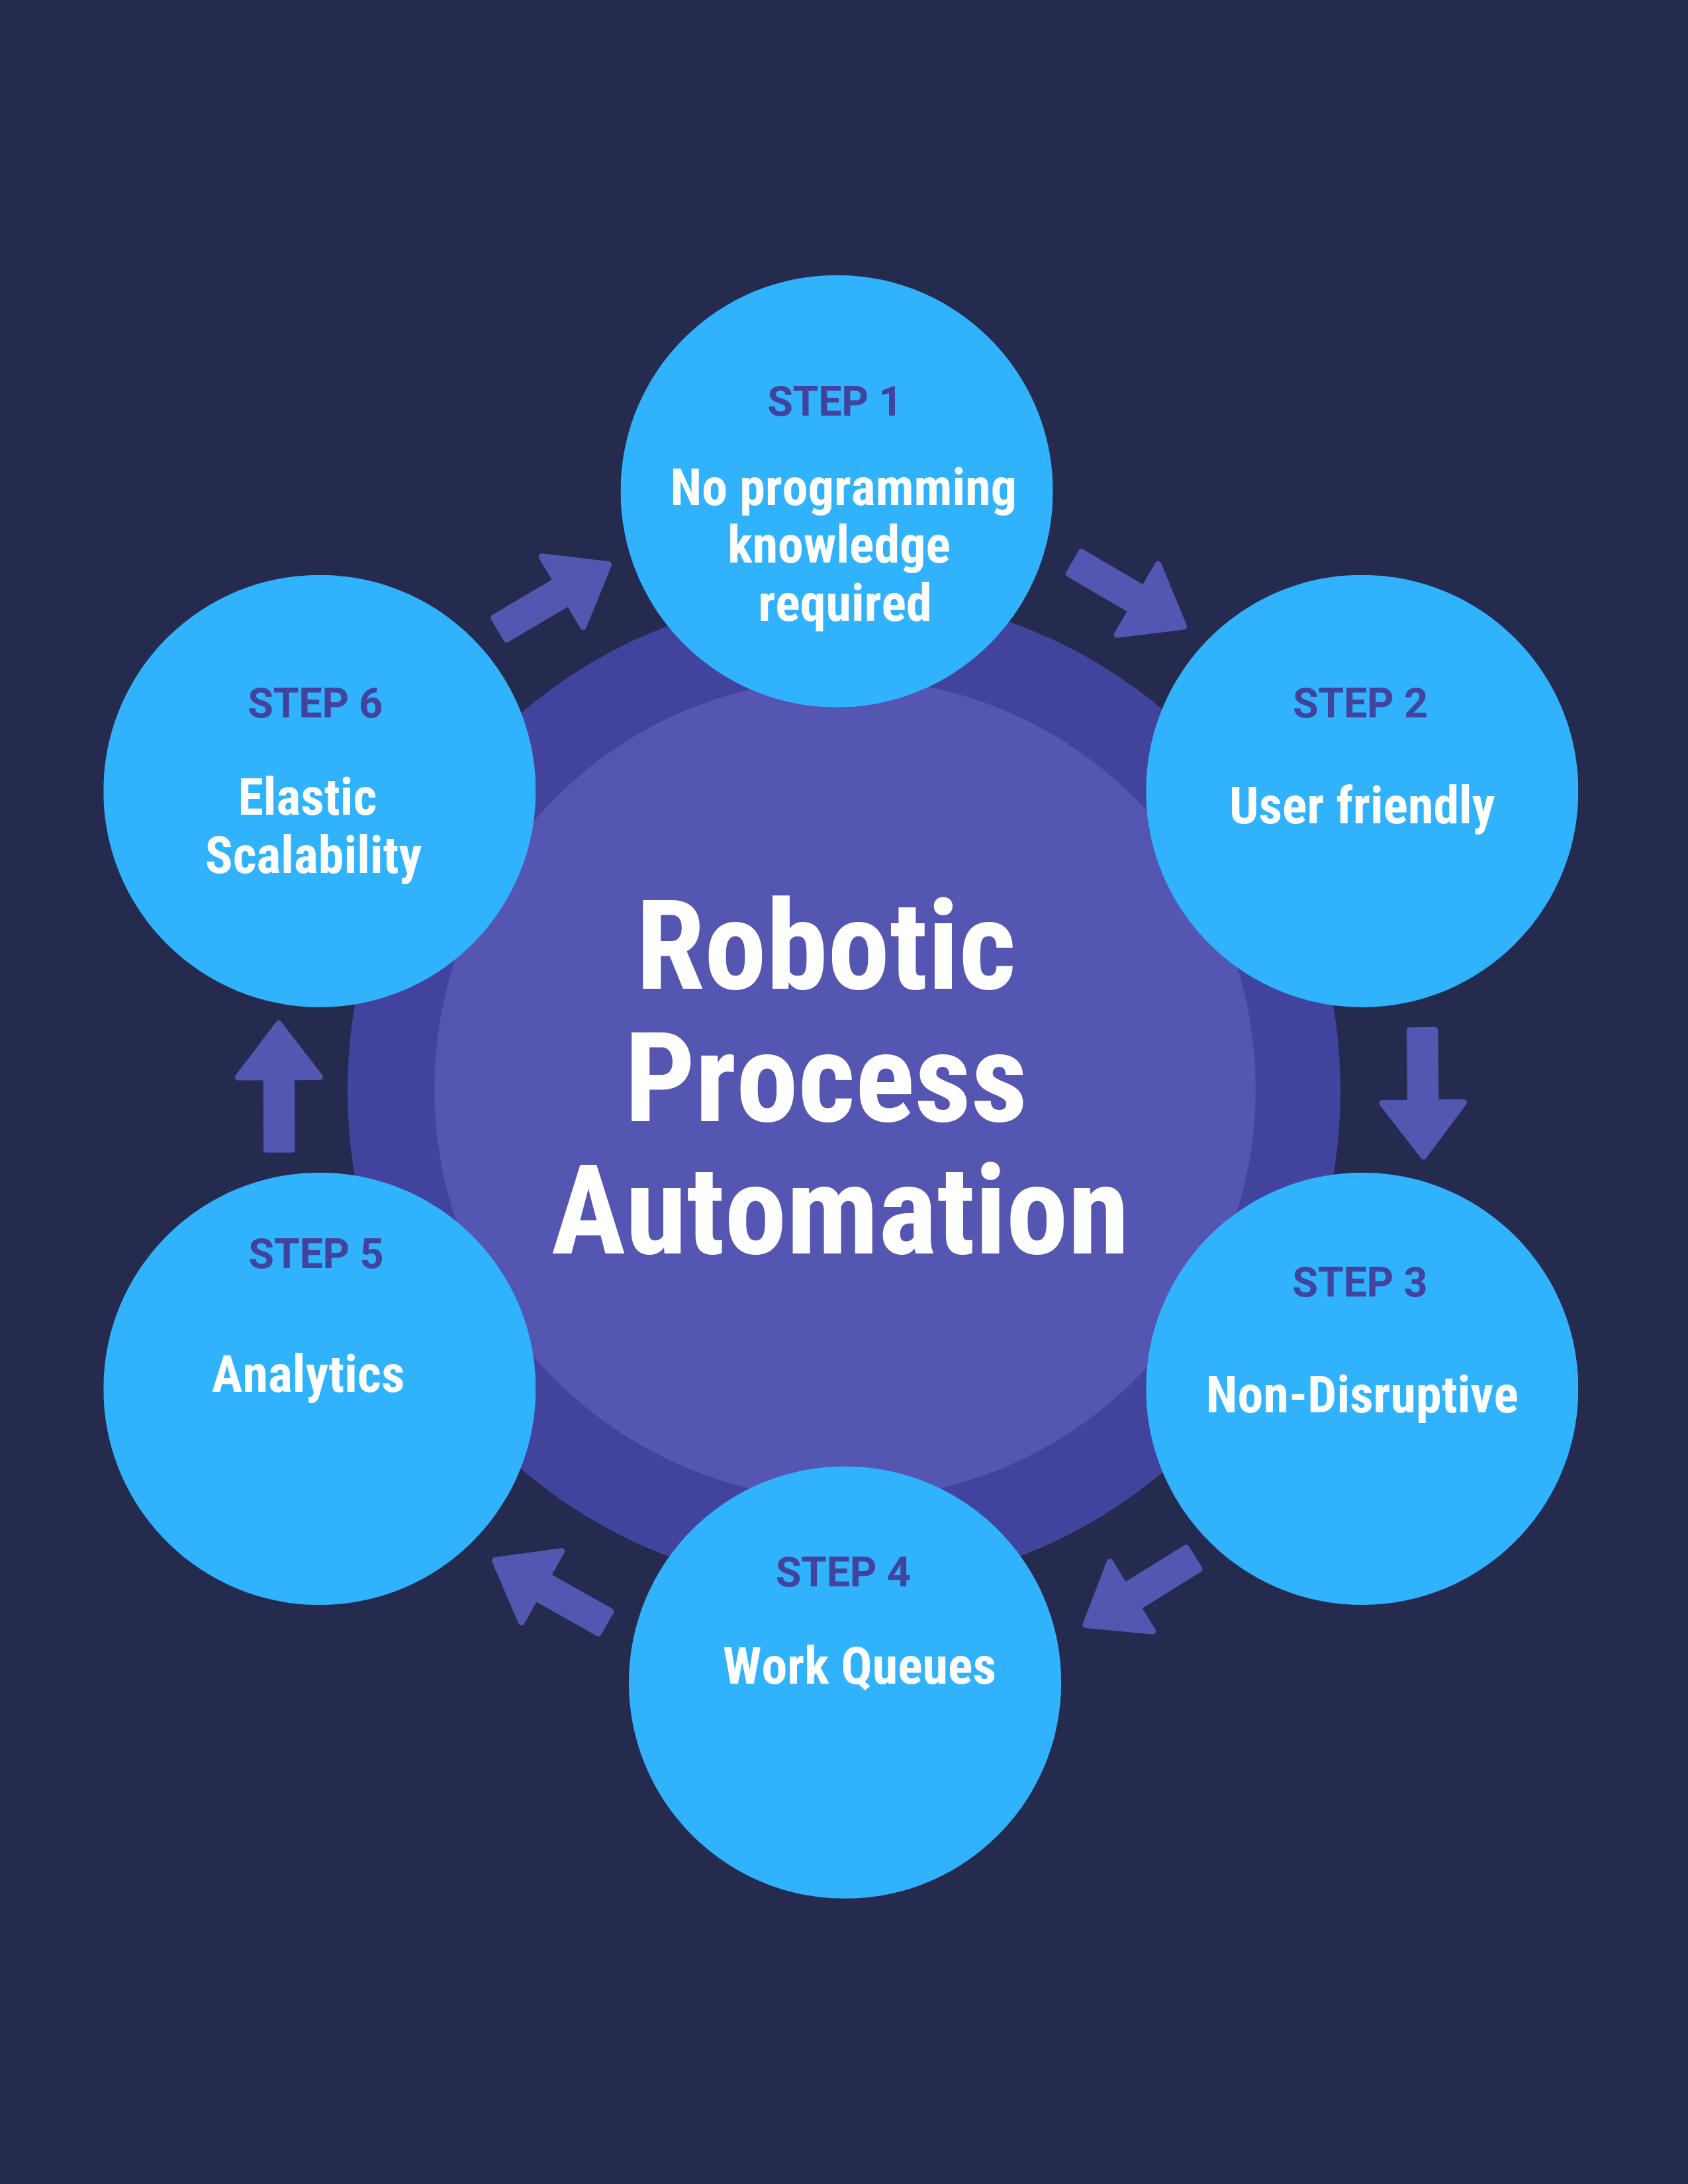 Perception analytics automated various enterprise processes in HR, Finance, Administration to IT which resulted increased accuracy and efficiency of day-to-day tasks. Some process automation involved automating repetitive tasks like creating support tickets when certain software fails which removed the need to manually create support tickets. Other implementation of process automation spaned from a simple approval workflow when an event occured to a more complex multi-level approval and delegation of tasks. They helped various departments streamline the sequence of tasks and their dependencies with speed, accuracy and traceability and increased consistency, reduced errors, and minimized delays or bottlenecks. The enterprise increased productivity, and achieved higher output with reduced effort and time.
Custom Software Development
Perception analytics helped enterprises with the development of software utilities and custom applications. Custom software development ranged from developing governance tools to business applications for Program Management office (PMO), HR, Finance and IT. We developed a cloud governance tool to upkeep the Office 365 (M365) power platform environment so that applications that are no longer active are archived and removed from the platform for peak performance. Our team helped develop a Project management application for various Program Management office (PMO) to track projects, timelines, resources, assessments, issues, risks, and dependencies. The application generates all sorts of reports from the weekly summary to quarterly accomplishments and KPIs (Key Performance Indicators) for each projects.